Innovation, protection, or strategic play?
The Effect of AI Patent Application on Company Performance: Evidence from North American Firms
Department of Economics · University of Warwick (2022–2025)
RAE Showcase & Idea Exchange
Everyone wants to be
“AI-powered”.
But is it worth it to protect an AI innovation?
A crash course on patents
AI patent filings rose sharply between 1991 and 2020, led by the United States and China1, and use spread well beyond the technology sector into pharmaceutical innovation2. Whether that growth pays is an empirical question, and it matters to firms and to policy in different ways.
Patents are a class of intellectual property granting a legal right to exclude others from using a new invention, but only once granted. Innovation drives long-run growth, so patents exist to make that innovation worth pursuing.
Patents are also signalling tools. Firms file to attract investors, strengthen a negotiating position with partners, and demonstrate value to host-country governments.
With AI, the boundaries blur. Who owns an AI-generated invention? Can a process be patented? Subject-matter eligibility is unsettled, and the rules are still being written.
For firms, it decides whether a filing is worth its cost. A granted patent can defend a market, a refused one is a fee paid for nothing. For policy, it tests rules that assume a patent creates value while inventorship and eligibility are unsettled.
What have people said?
There is no shortage of work on patents and firm performance. It pools AI with every other patent, treats patent counts as a proxy for adoption, or reads the legal rules without testing them – and almost none of it asks what filing an AI patent does to the firm that files.
Helmers and Rogers
2011 · UK
Filers grow assets faster than non-filers.
- Selection by controls, not matching
- Application and grant never separated
Taglialatela and Barontini
2024 · Italy
Applications lift sales for up to three years.
- AI pooled with non-AI
- Cohorts pooled
Yang
2022 · Taiwan
AI adoption raises productivity and employment.
- AI patents proxy for adoption
- Two-way fixed effects, no cohort weights
Marioni, Rincon-Aznar and Venturini
2024 · Europe
Gains are largest furthest from the frontier.
- Patents as an indicator, not an asset
- Productivity, not firm value
Müller; Hickey and Zirpoli
2024
AI eligibility narrowed through the 2010s.
- Describes the rules, tests nothing
- No firm outcome, no filing link
- Research – AI patents treated as an IP category of their own and matched against non‑AI patents on the same design, so the estimates separate AI innovation from innovation in general. North America, where recent AI patenting growth has concentrated, and measured at application as well as at grant.
- Methodological – cohort weights in PSM–DID in place of pooled cohorts, and a neural network in place of logit or probit when estimating propensity scores.
How does AI patenting affect firm performance?
Most studies treat filing and grant as one thing. They cost a firm completely different amounts — filing is money spent on a bet, and the grant is what you get if it lands.
EBITDA is the internal measure — what the business actually earns, before financing and accounting conventions. Revenue and market value sit alongside it as the external measures of what customers buy and what investors expect.
A firm's AI patenting activity — either applying or being granted. Filing sets t = 0, and outcomes are traced either side of it, so parallel trends are tested rather than assumed.
Two effects I want to pull apart. The application effect, filers against firms that never file. The grant effect, granted applicants against applicants who weren’t. Then whether either looks different for AI patents than for non‑AI ones — in case AI has something special about it.
Constructing the firm panel
Through fuzzy matching, a further match on city and postcode, and filtering, the applicants that come out are not comparable with the firms they are measured against.
Firms that file an AI patent are already larger and more profitable than the firms they would be compared against, so a like-for-like comparison does not exist in the raw data.
The matched data then went through the filtering procedures and propensity score matching (more on that later!).
Identification strategy & NN‑PSM
A cohort event study in modern microeconometrics, matched by a neural network.
Difference in differences
- αi is fixed per firm and filing, so permanent differences drop out and a second application is its own unit
- δt is a year fixed effect, so common shocks drop out
- βc,j is what survives, and is valid only if both groups would have moved together
- Treated and control swap — applicants against non‑filers gives the application effect, granted against non‑granted gives the grant effect
Leaves behind selection: filers are already larger, and already growing faster.
Propensity matching
- Logit and probit force a form on covariates that interact; misspecification biases every score
- The network learns that form instead, with two hidden layers
- Tuned by black‑box Bayesian optimisation; out-of-sample AUC 0.70–0.81
- The score is the probability of applying, not of being granted
Leaves behind timing: matched pairs still sit in one pooled regression.
AUC is the chance the score ranks a random filer above a random non‑filer. 0.5 is a coin toss; 0.70–0.81 is high for a behavioural outcome. Matched separately means each design draws its own controls — filers against non‑filers, granted against not‑granted, AI against non‑AI. The same application score is reused for all three, which is exact for the first and an approximation for the grant effect. Hornik et al. 1989 · Setoguchi et al. 2008 · Brochu et al. 2010 · Orbach et al. 2023
Cohort weighting
- Cohorts differ: 2012 and 2019 filers met different markets, adoption rates, macro conditions
- Already‑treated firms act as controls, so αi + δt weights cohorts by variance, some negative, and β need not average to real effects
- So I estimate β per cohort c and event year j (the double sum), then weight by cohort size
Leaves behind reverse causality: a strong year may be what prompts the filing, so which way the cause runs stays open.
A cohort is the set of firms first treated in the same year; never‑treated firms are the comparison throughout. The problem is the weighting, not that the cohorts differ. Implemented as Sun and Abraham: each cohort on its own event time, weighted by size, no firm used as a control once treated. Sun & Abraham 2021 · de Chaisemartin & D'Haultfœuille 2020 · Goodman‑Bacon 2021
Sample restriction
- First-time filers only, or no filings in the two prior years, so Yits is observed for a defined set of firm-years
- Closes the route from a good year to the filing
- Rebased to t−3, so anticipation shows as a pre‑trend
Closes the sequence: what remains is what the design cannot reach.
Headline figures
Pooled across both stages, AI patenting nets to zero. Separated, application destroys operating value and grant creates it — and both effects are large.
A closer look
EBITDA at event time, rebased to t−3. Application and grant, read against the same axis.
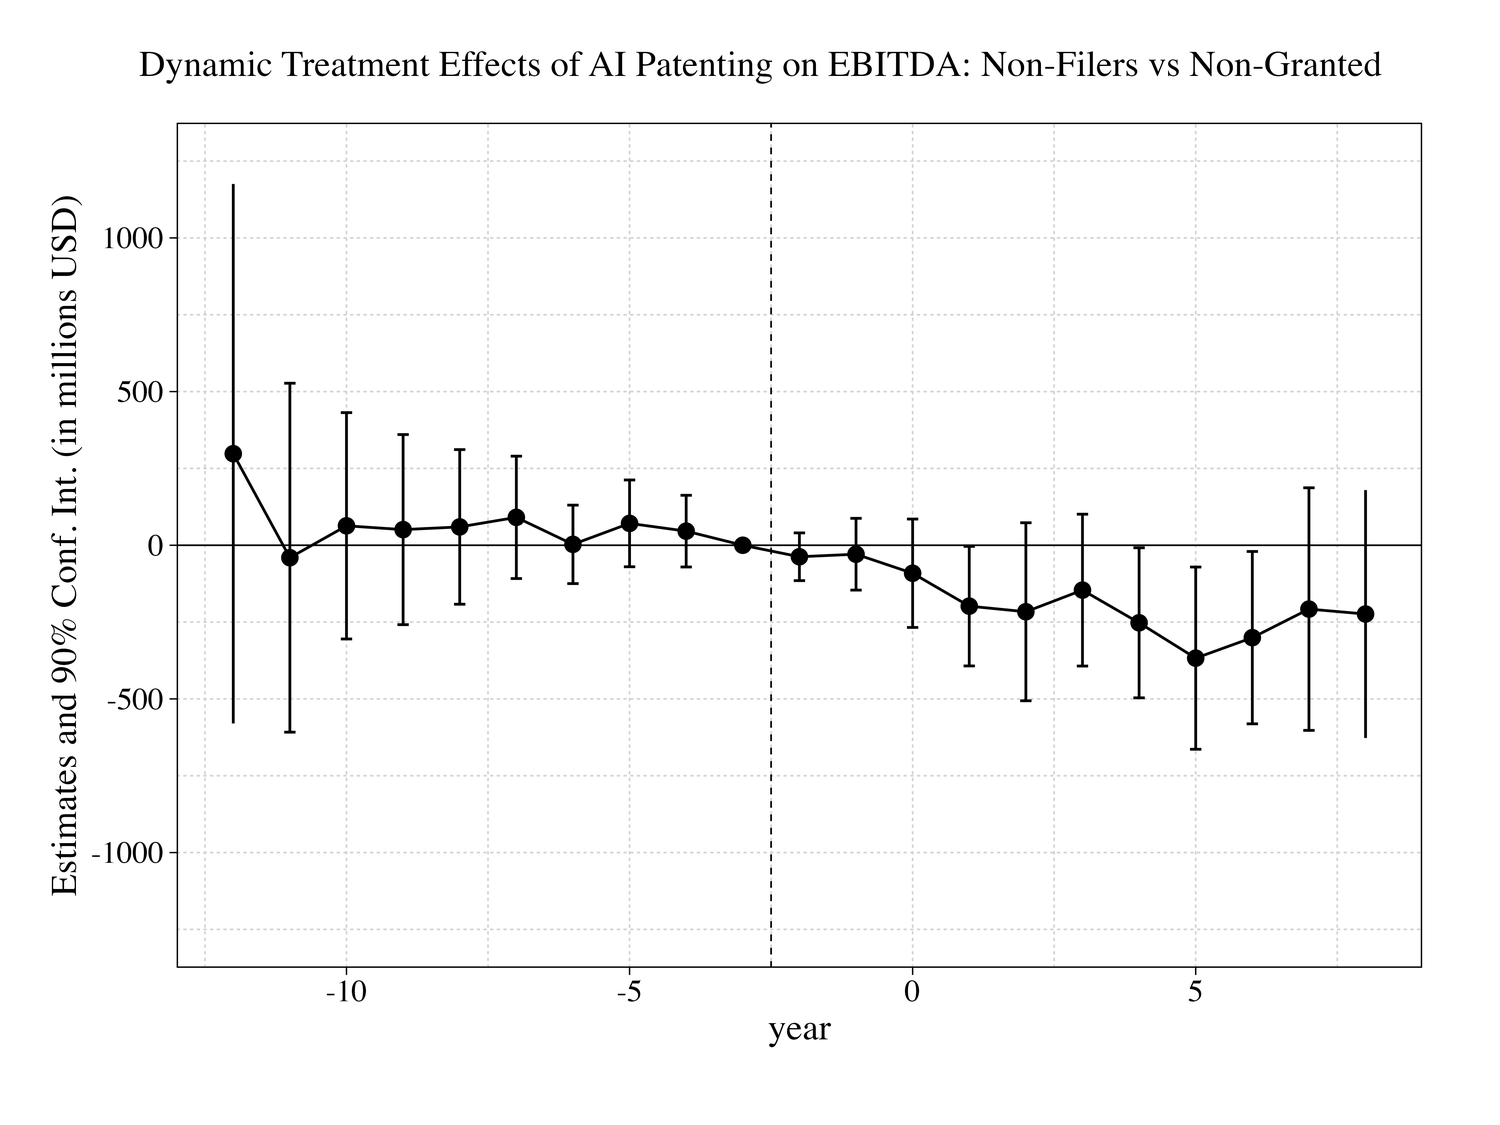
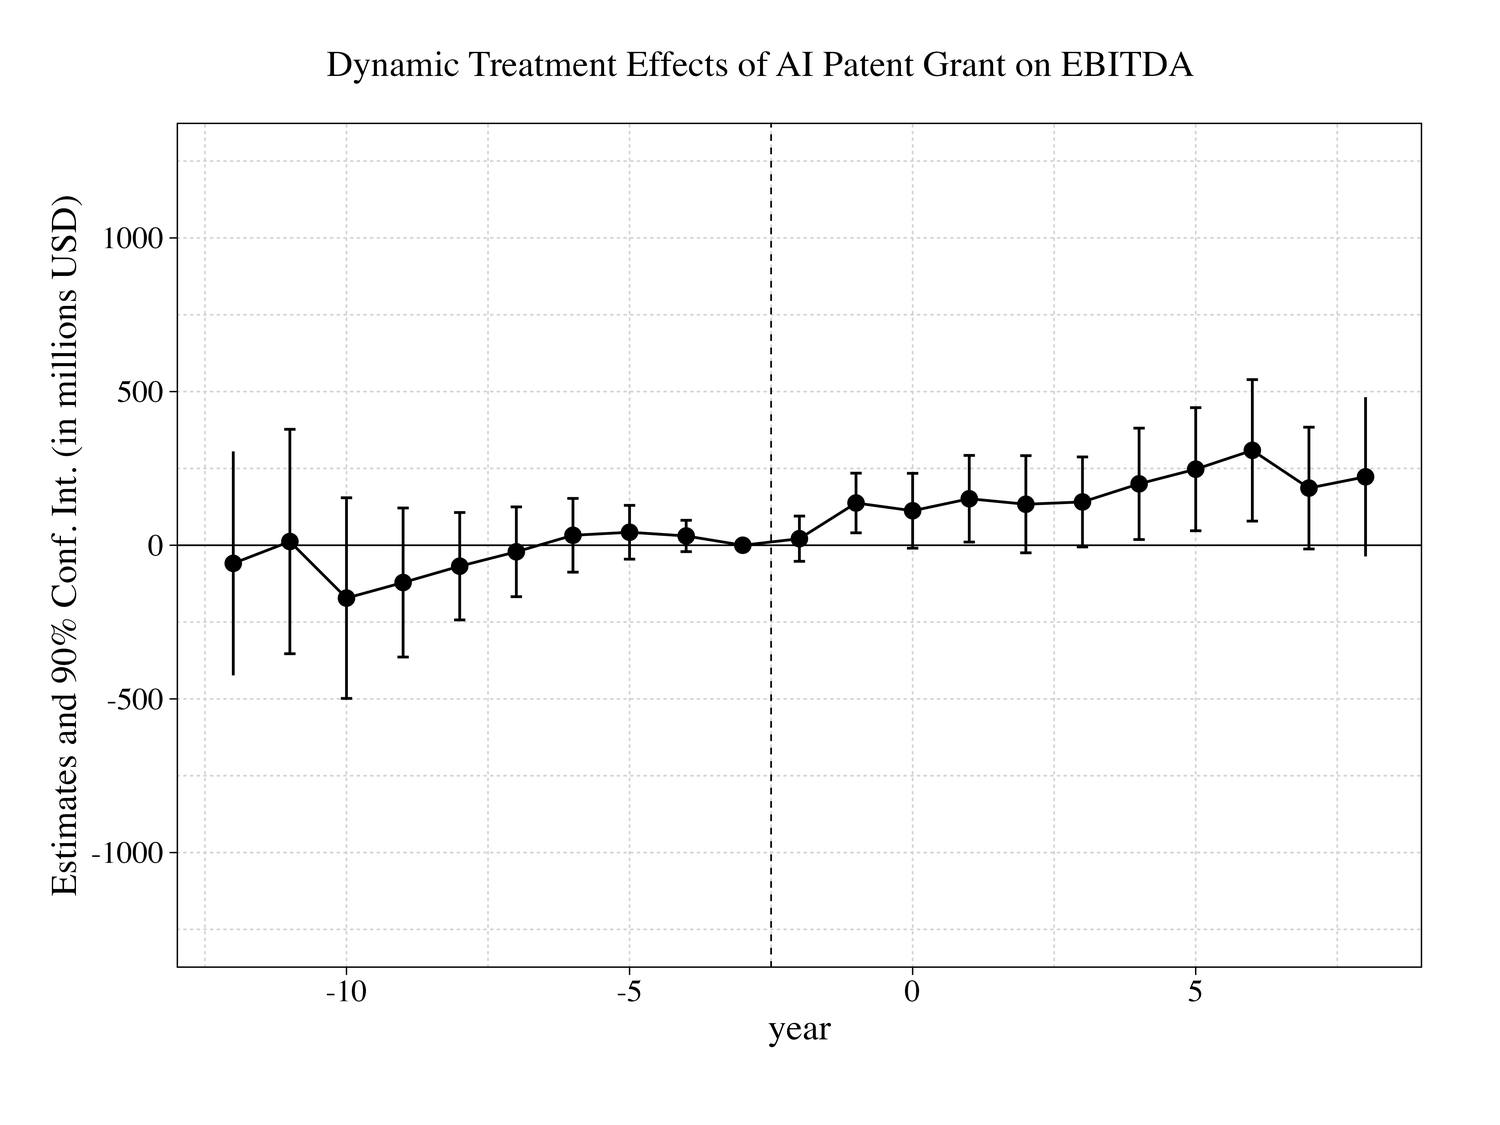
No coefficient before treatment is significant in either panel, so the turn at the boundary is the treatment rather than a trend already in motion.
Beyond the headline
EBITDA is the only outcome that responds to a grant. And the technology only matters once it is granted.
What held, and what is assumed
Estimate grant propensity directly, conditional on application, rather than borrowing the application score. Test whether the two‑year buffer is long enough, and set the network against logit and probit on the same covariates. Above all, establish what actually determines patenting.
You only get paid if it's granted
Filing without a grant costs $300.70m of EBITDA by year six. Getting one adds $308.79m, and the gap keeps widening.
AI patents pay back sooner than non‑AI patents
EBITDA responds before an AI grant even issues. A non‑AI grant does not move it until year seven.
The two effects have to be read separately
Added together, the loss from filing and the gain from the grant cancel out. That gives you a non-effect, when in reality both things are happening.
Thank you.
Questions, challenges and counter-arguments welcome. The six specifications, the network and the matching diagnostics are one key away — press B.
Department of Economics · University of Warwick (2022–2025)
RAE Showcase & Idea Exchange
The six specifications
Which firms count as treated changes with the question. That gives six specifications, each run on three outcomes — EBITDA, revenue and market value. 18 regressions.
Some firms apply and then get granted, so (1) and (4) have a grant sitting inside the treated group. (2) and (5) take the grantees out, and what is left is the application on its own.
The propensity network
A neural network stacks layers of neurons, each taking a weighted sum of the layer below and bending it through a nonlinearity. Big enough stacks approximate almost any continuous function, so the score here is learnt from key firm variables and their lags instead of assumed.
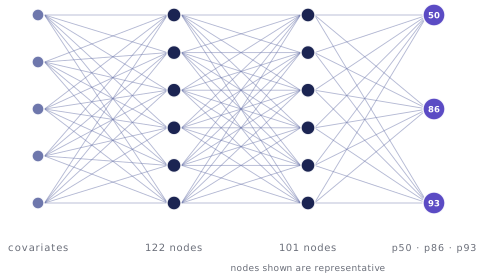
Training. An 80/20 stratified split, ReLU hidden layers, dropout 0.2 against memorising the firms it has seen, and Adam for faster convergence. Because only about a quarter of patenting firms are treated, the model is scored on AUC‑ROC rather than accuracy. The nine settings were picked by black‑box Bayesian optimisation. A Gaussian process is fitted to the validation AUC already observed, expected improvement chooses each next configuration, and 75 evaluations do the work a grid search would need thousands for.
Matching quality
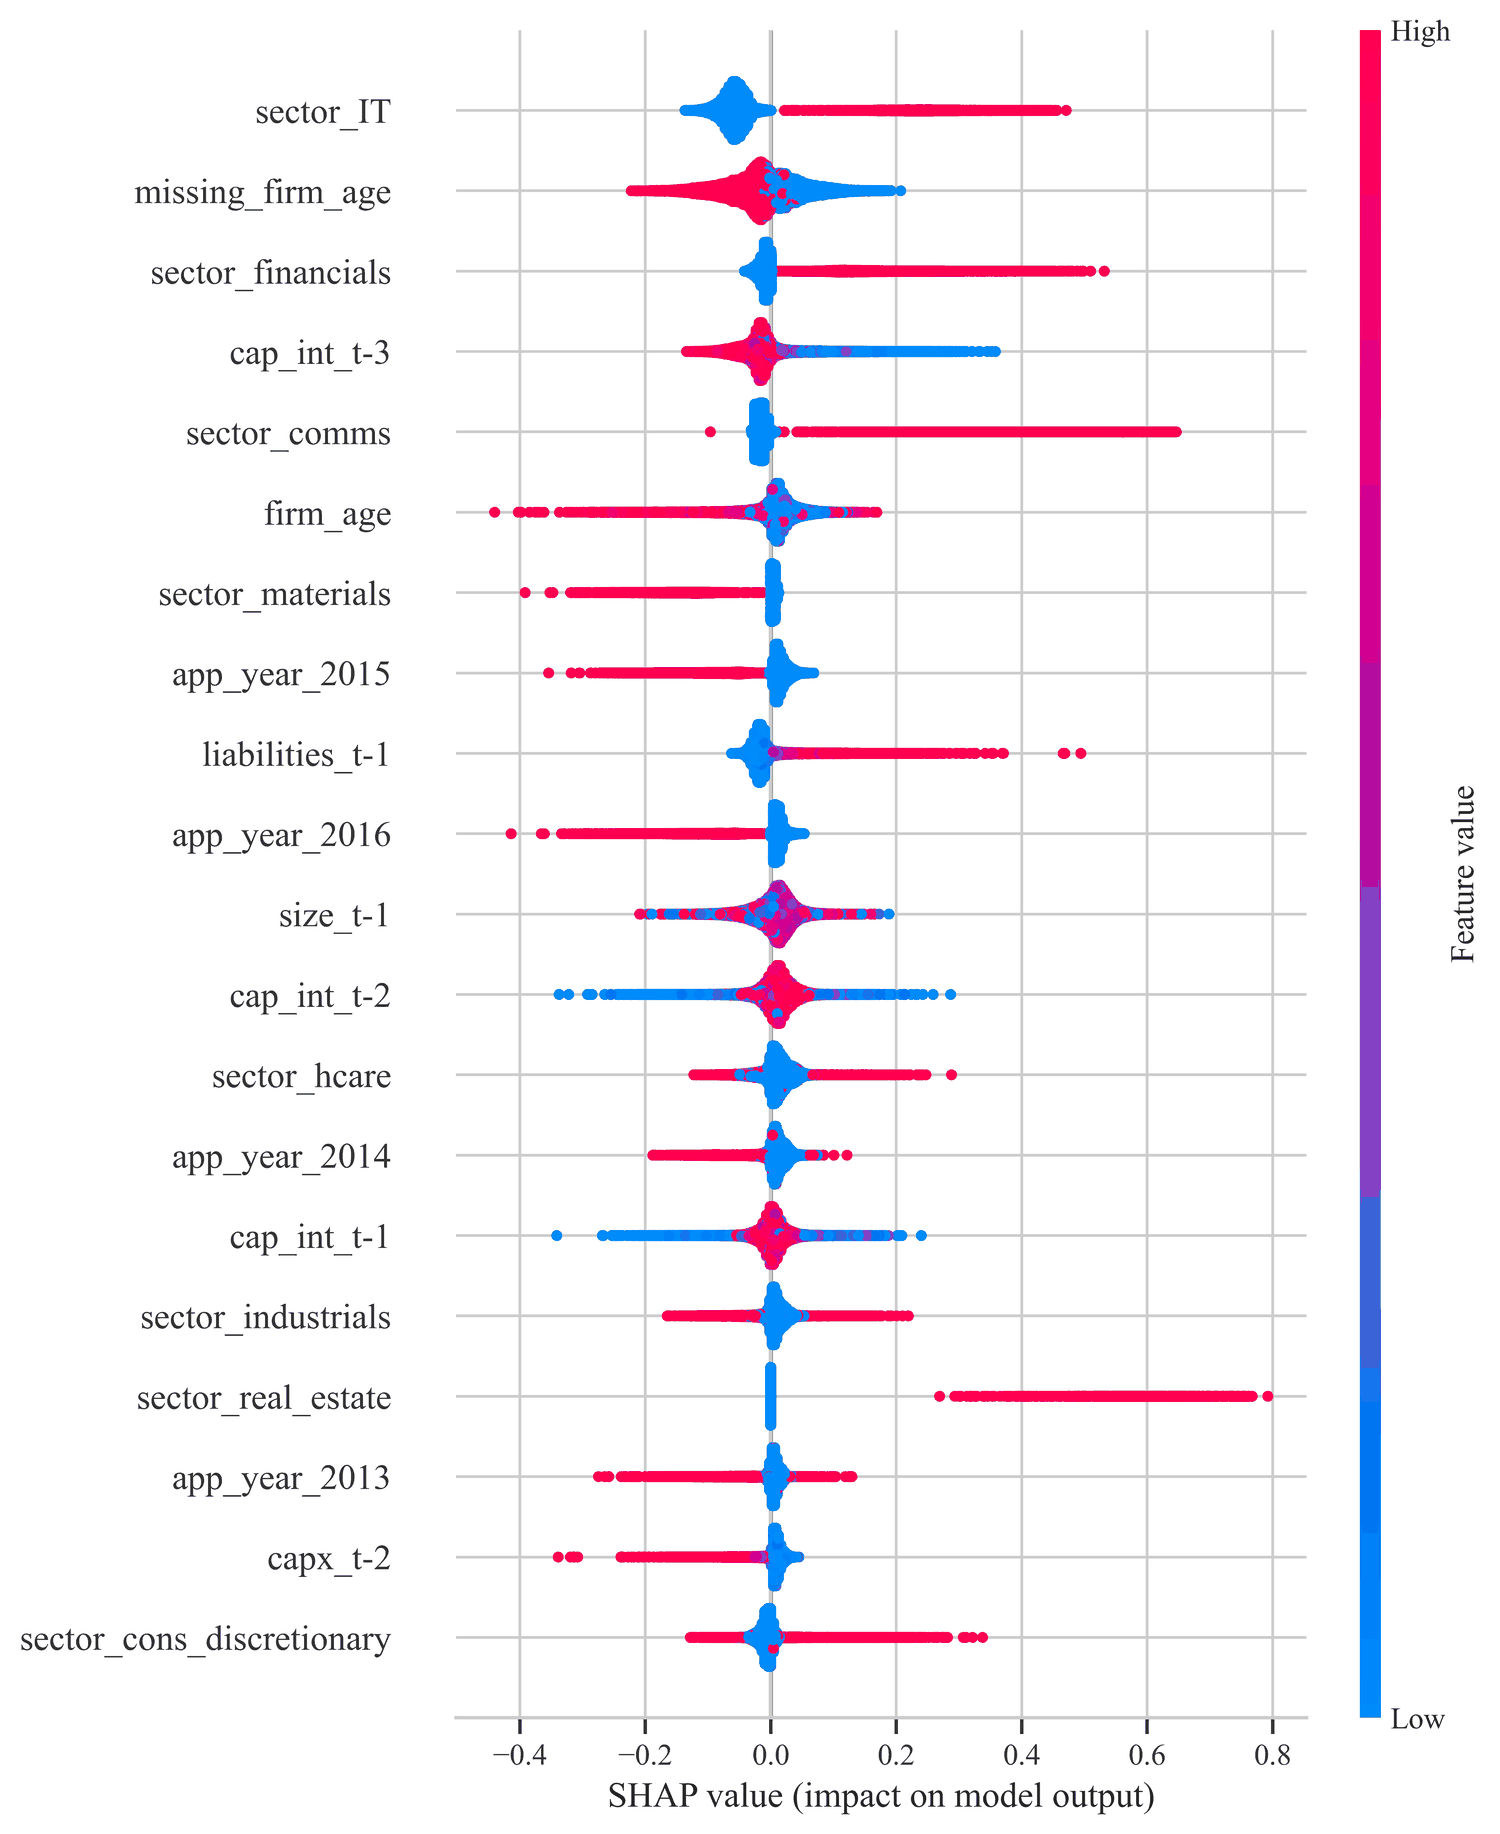
What matching did to the covariates, and what the network was reading when it scored a firm.
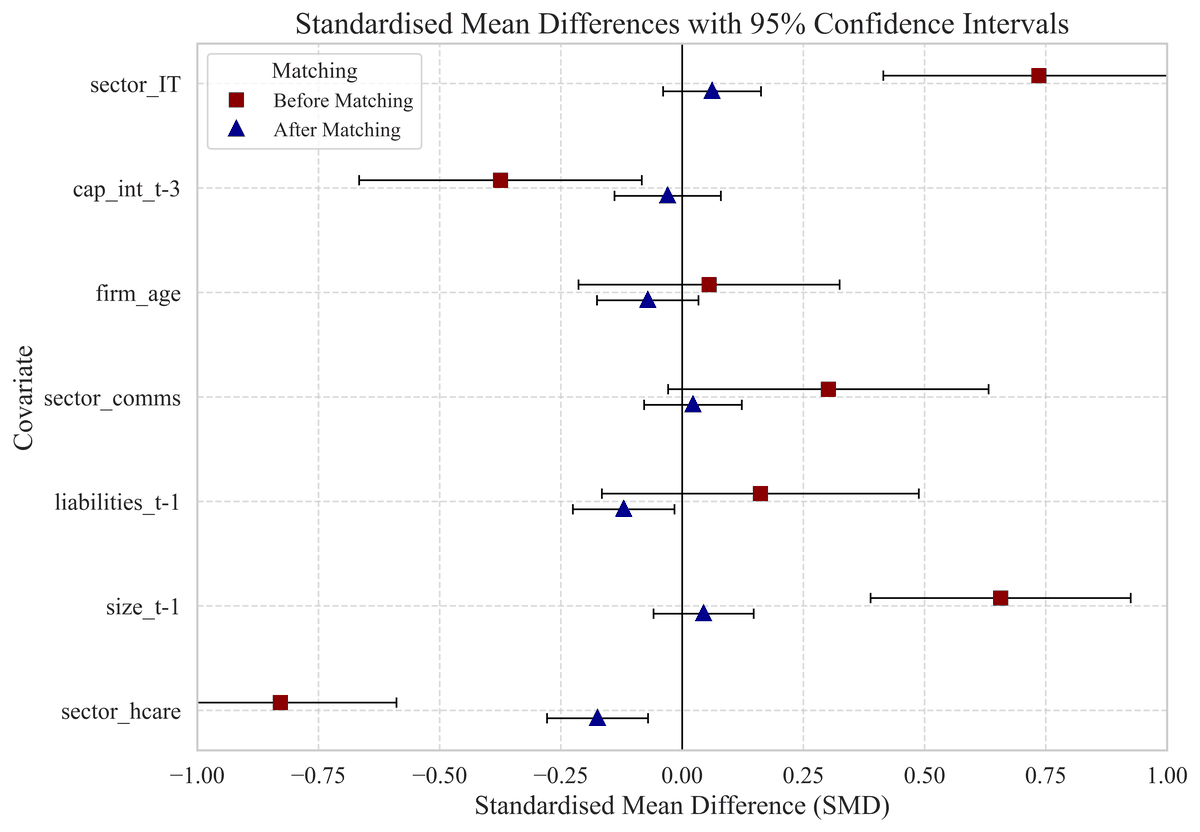
Balance. Matching improves balance on the key covariates in most specifications. Specification (5) deteriorates on a few variables, though parallel trends for EBITDA holds regardless, and that is what the estimates rely on.
Plausibility. Finance, information and communication-services firms are the most likely to apply, and older firms the least. The ranking matches economic intuition, which is the only check available here, and the mechanisms behind it are not identified.